 STOCK PORTFOLIO (ONE)
Dashboard
Feature / Dashboard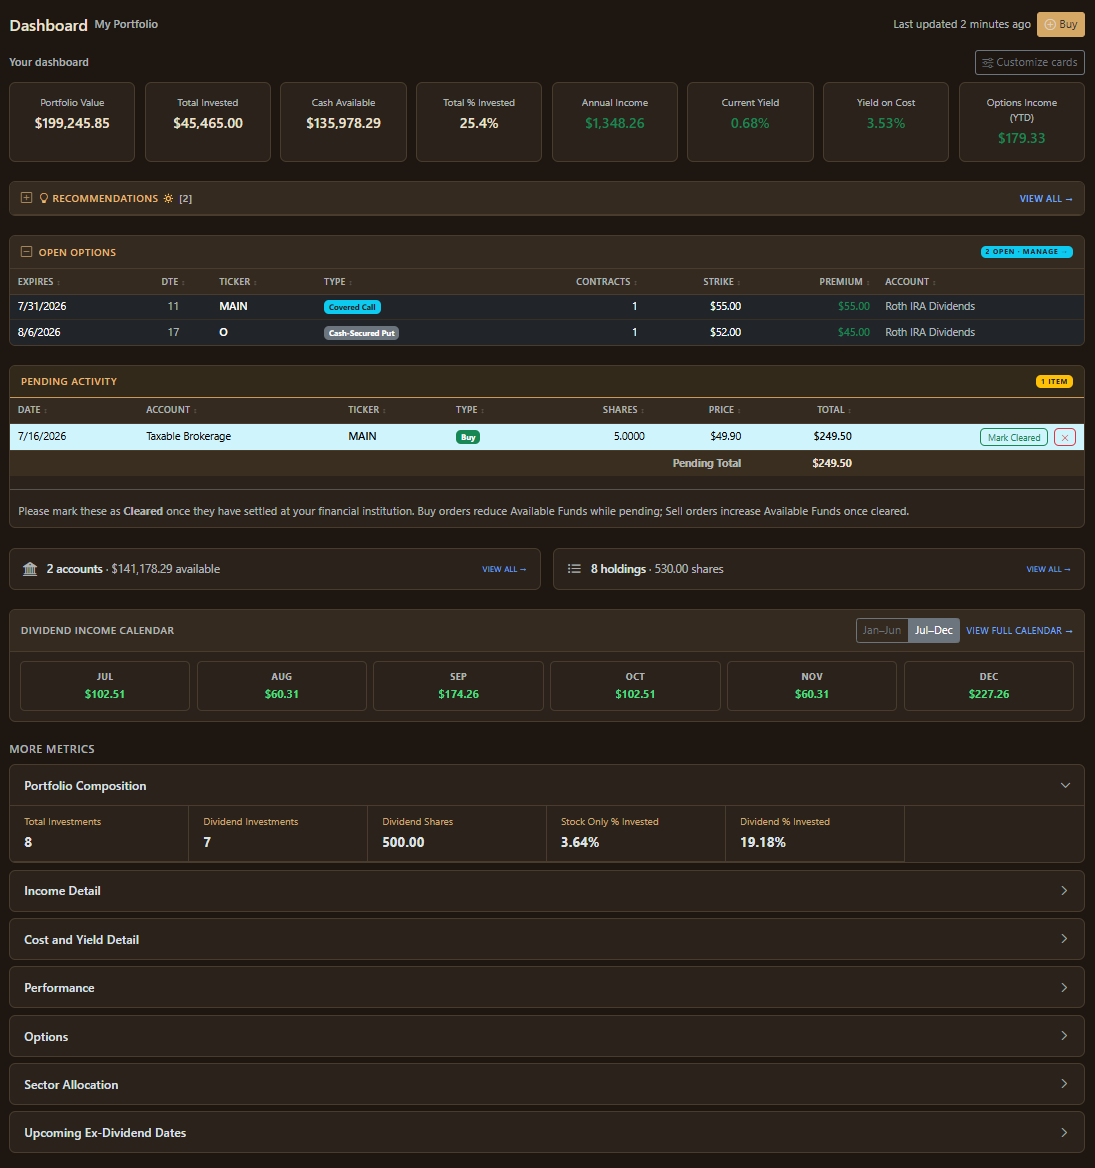
The Dashboard gives you a snapshot of your investment information.
| Portfolio Value | This is the total of all all accounts in your portfolio. |
| Total Invested | This value shows how much you have invested across your portfolio. |
| Cash Available | This value shows how much you current have to invest. |
| Total % Invested | This metric is helpful to gauge whether you want to leave some money uninvested. |
| Annual Income | This is based on all dividends in your portfolio. |
| Current Yield | This is based on the current price of your assets. |
| Yield on Cost | This is based on the cost of your assets (helpful to accelerate reinvested dividends). |
| Options Income (YTD) | This is the total of all options sold (covered calls and cash-secured puts). |
Recommendations
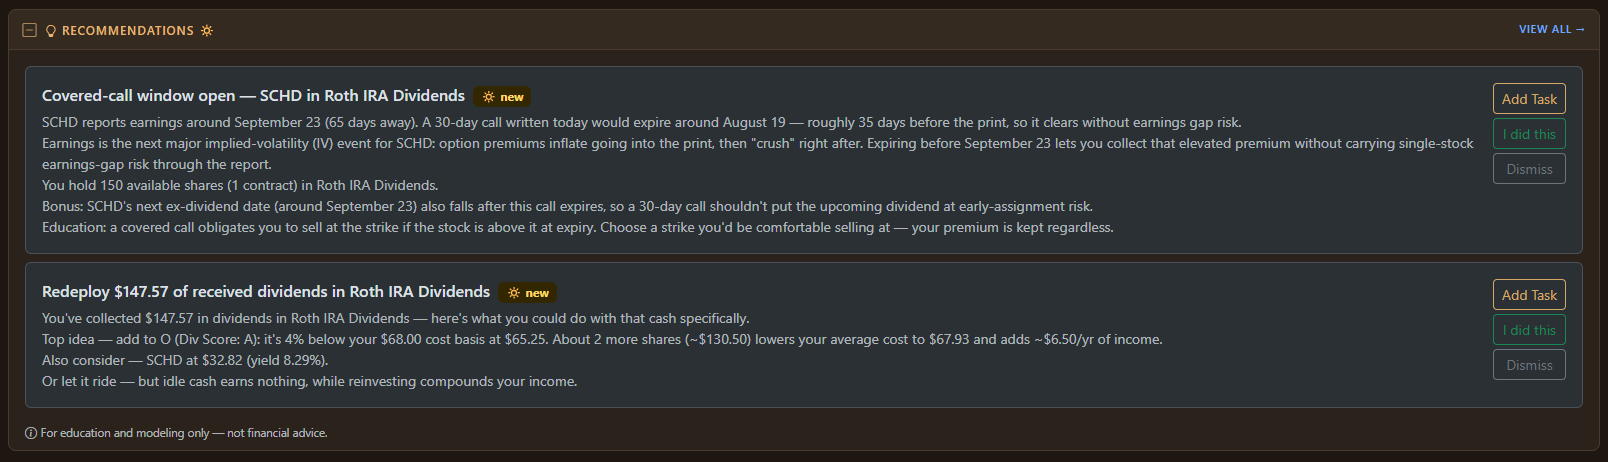
These provide direct information about available covered-call windows and suggestions about redeploying dividends.
Click on "Add" Task to push this to your desk.
Open Options

Here you can see what options you have sold, Days 'Til Expiration (DTE), Strike (The price the stock must exceed before someone would try and exercise this contract) and also how much you earned from this transaction.
Pending Activity

When something changes in your portfolio, you have a chance to see what changed and can also go into history to undo it later (unless its from a linked account).
Navigation and Calendar

You can quickly access your accounts and stocks. The Dividend Income Calendar provides an easy to heads-up of dividends that are coming.
You can always click on full calendar to see a weekly, monthly or quarterly view.
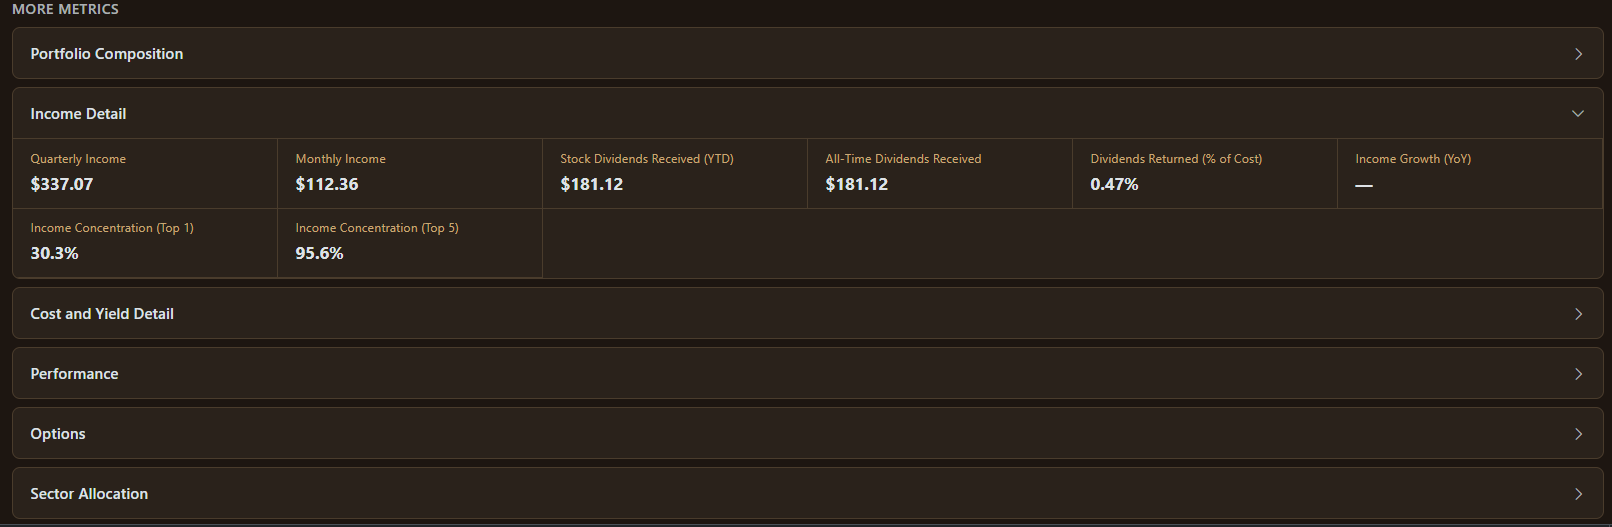
The remain metrics are organized into accordions to better answer most questions about your investments.